Brentwood Area Report – September 2019
The Brentwood (Los Angeles Westside) Area Report offers insight into residential real estate sales activity and regional trends. It gives a broad look at the real estate market.
The market summary below lets you see sales activity for the prior month and year, along with current and past year-to-date statistics. The graphs cover several different aspects of the real estate market. Note how some of the graphs break out trends by price increments. Read on and let the trends be seen in real numbers. Please contact me if you would like more information.
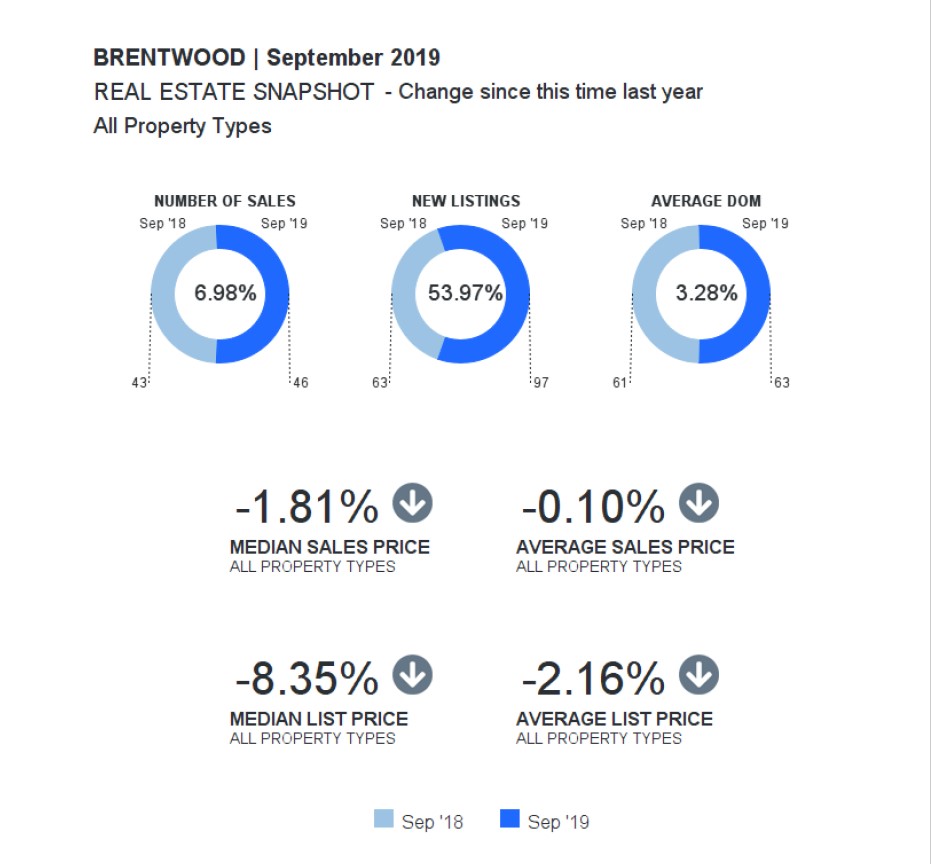
As you can see in the in the Real Estate Snapshot, the number of sales and average days on market in Brentwood for 2019 slightly surpassed 2018. New listings, however, jumped over 53%. Median and average sales prices remain stable while median and average list prices declined fractionally.
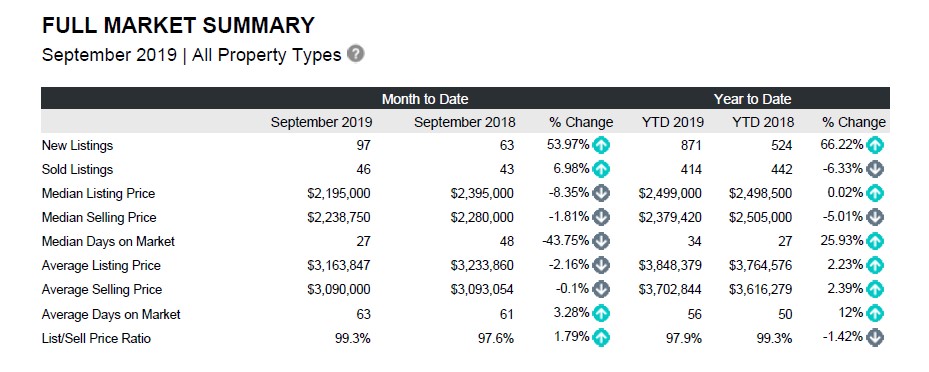
In the Full Market Summary we see an over 53% increase in new listings and 7% more sales, 2019 over 2018. Median listing prices have declined 8% while median selling prices have declined less than 2%. Importantly, median days on the market have declined by almost 44% to an average of 27 days. Average days on market is up 3% and the list/sell price ratio is less than 2%.
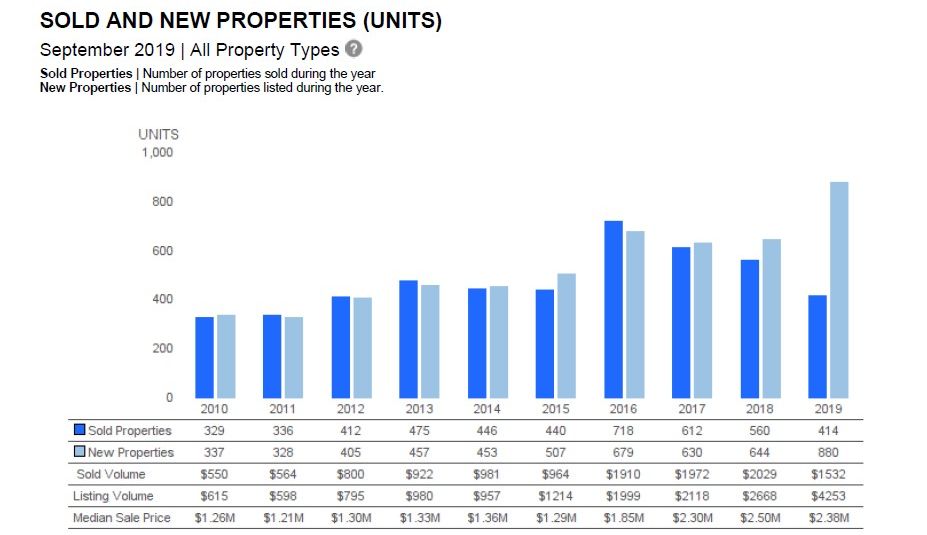
In the Sold and New Properties graph we see ever increasing volume of both categories with 2019 showing the widest disparity with 880 sold properties versus 414 sold properties.
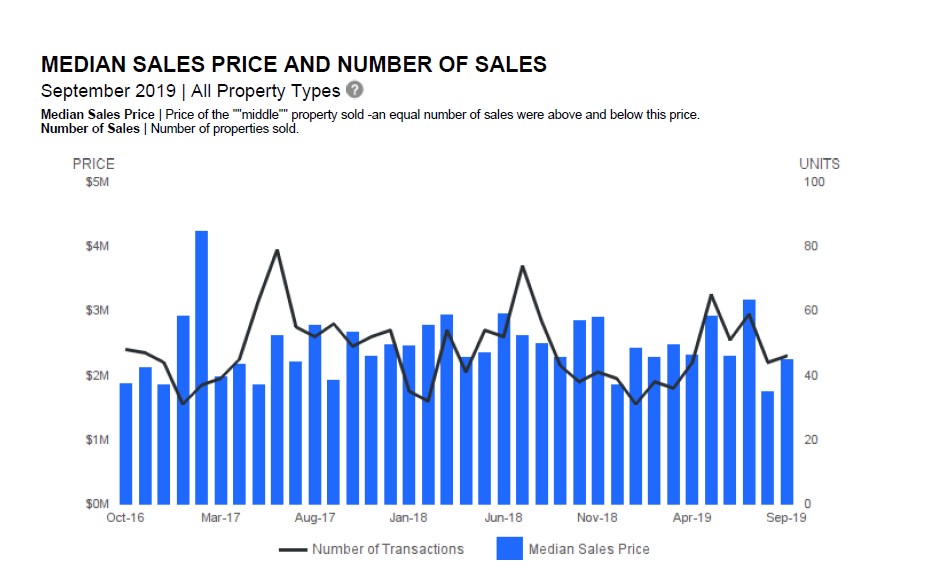
In the Median Sales Price and Number of Sales graph from October 2016 to September 2019, but for a price spike in early 2017, we see level and stable trend. Note August of 2019, we see a decline in prices that may show more of a run on lower priced properties. This is something to track over the next few months.
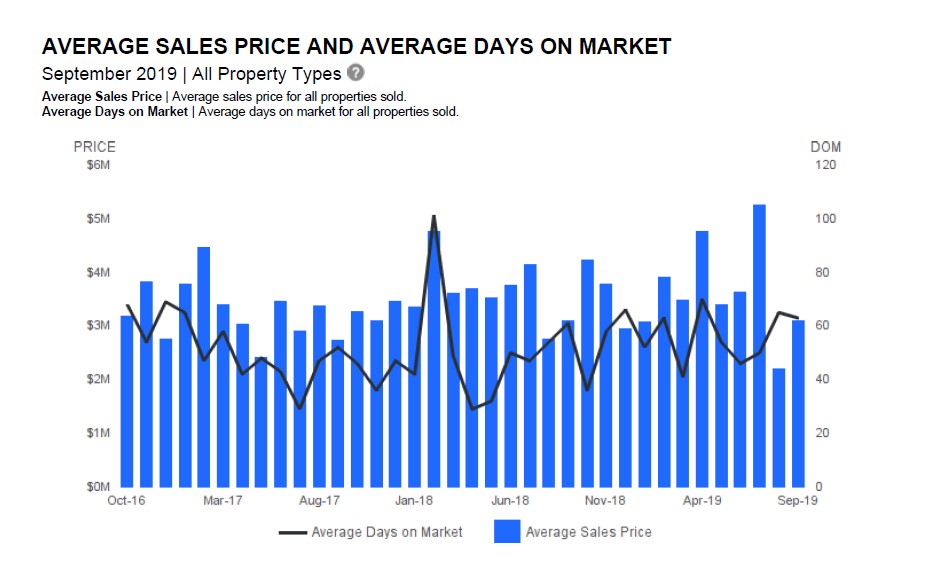
In the Average Sales Price and Average Days on Market graph from October 2016 to September 2019, but for a price and days on market spike in early 2018, we see level but climbing average sales prices while days on the market is lower.
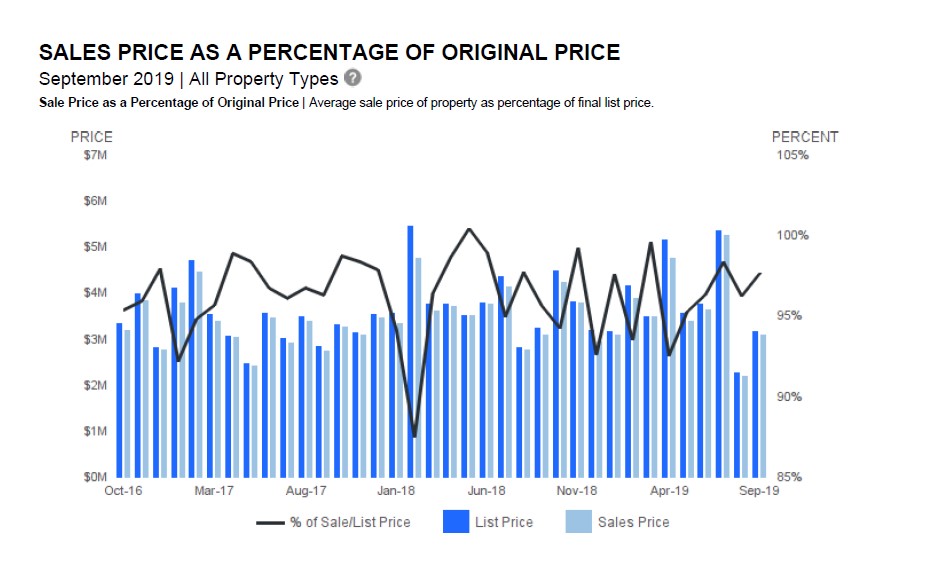
In the Sales Price as a Percentage of Original Price graph from October 2016 to September 2019, but for a vast decline in early 2018, we see level and stable trend, excluding August and September 2019 where prices declined quite a bit.
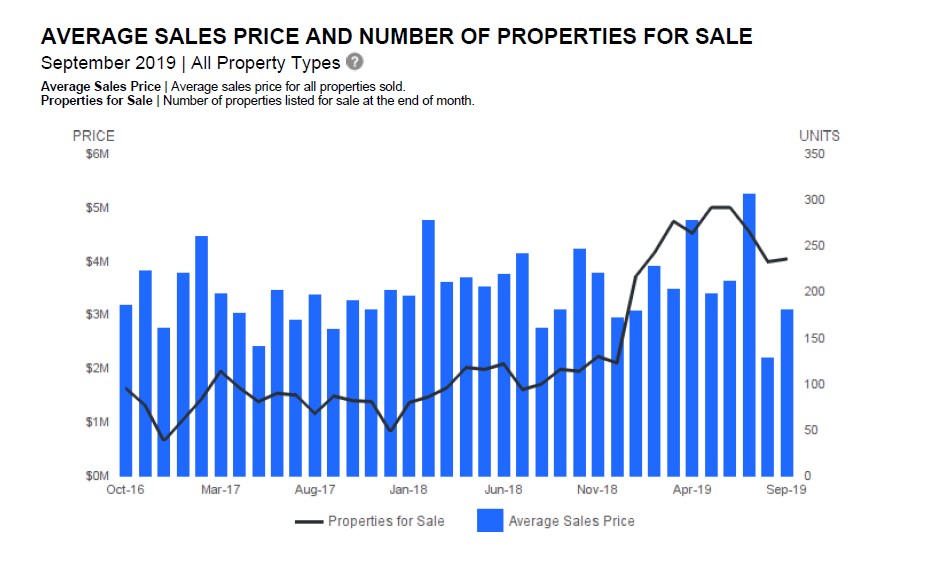
In the Average Sales Price and Number of Properties for Sale graph from October 2016 to September 2019, but for a few spikes that seem to indicate a slight price trend upward, excluding August and September 2019 where prices declined quite a bit compared to the trend for all of 2019.
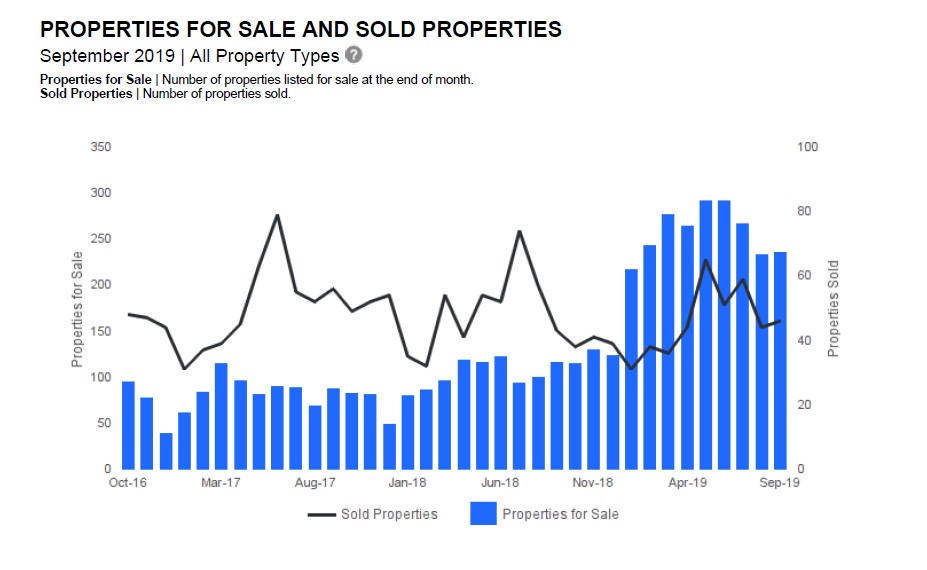
In the Properties For Sale and Sold Properties graph from October 2016 to September 2019, we see a huge price jump starting in early 2019 with a decline in August and September 2019. This is a trend worth watching.
These are interesting times and well worth tracking.
The statistics presented in the Area Report are compiled based on figures and data generated by IDC Global and Datafloat and may not be completely accurate. All information should be independently verified for accuracy. Properties may or may not be listed by the office/agent presenting the information. Not intended as a solicitation if your property is already listed by another broker. Real estate agents affiliated with Coldwell Banker Residential Brokerage are independent contractor agents and are not employees of the Company.
 ©2019 Coldwell Banker Residential Brokerage. All Rights Reserved. Coldwell Banker Residential Brokerage fully supports the principles of the Fair Housing Act and the Equal Opportunity Act. Owned by a subsidiary of NRT LLC. Coldwell Banker and the Coldwell Banker Logo are registered service marks owned by Coldwell Banker Real Estate LLC.